Changing Log Levels in a Running Application
As a Site Reliability Engineer, my primary directive is to make sure systems are performing well for my customers and to take corrective action when they are not. In the middle of an incident, I often find myself looking at various application logs to determine what is happening in the system at any given time.
When a system is performing well, there is usually no reason to log verbosely. Once you find yourself searching through the logs though, it becomes very apparent that WARN and ERROR level logging are not always sufficient.
This must be a common problem, as Google’s Site Reliability Engineering also mentions how powerful changing log levels can be in a running application. The benefit is obvious — you have a system not behaving like it should, and you need to know why. Restarting or redeploying the system could mask the issue or make things worse. Leaving an impaired system running and increasing the granularity of its logs can help uncover the issue.
So, how do you build that?
Let’s create an example rooted in reality. We’ll build a simple HTTP web server in Go with two endpoints: /-/config and /-/reload. The /-/config endpoint will accept GET requests and display the currently loaded configuration. The /-/reload endpoint will acceptPOST requests and trigger a reload of the logging configuration.
Once we’ve got those handlers defined, we need to register them with our server and start it. We will also define an initial logger (using Logrus) so that we have something to start with. I am using Logrus because Go’s standard log package does not support log levels.
Now that we have a functional HTTP server, we need to move on to the core of our code: configuring the logger. We will perform that configuration in YAML. The configurable settings will be the log format (text or json), colors enabled or disabled (boolean; text format only), and the verbosity level of the logs (any of: trace, debug, info, warning, error, fatal, panic).
Let’s define two structs: one for our logging configuration and one for other configuration-related items we might want to add in the future.
structs representing the configuration for the web server’s logger.We will also create a config.yaml file. An example configuration will look like this:
logging:
  level: info
  format: json
  colors: false
In order to reload the configuration, we’ll need to read the file from the machine, parse it from YAML into our structs and adjust the logger accordingly.
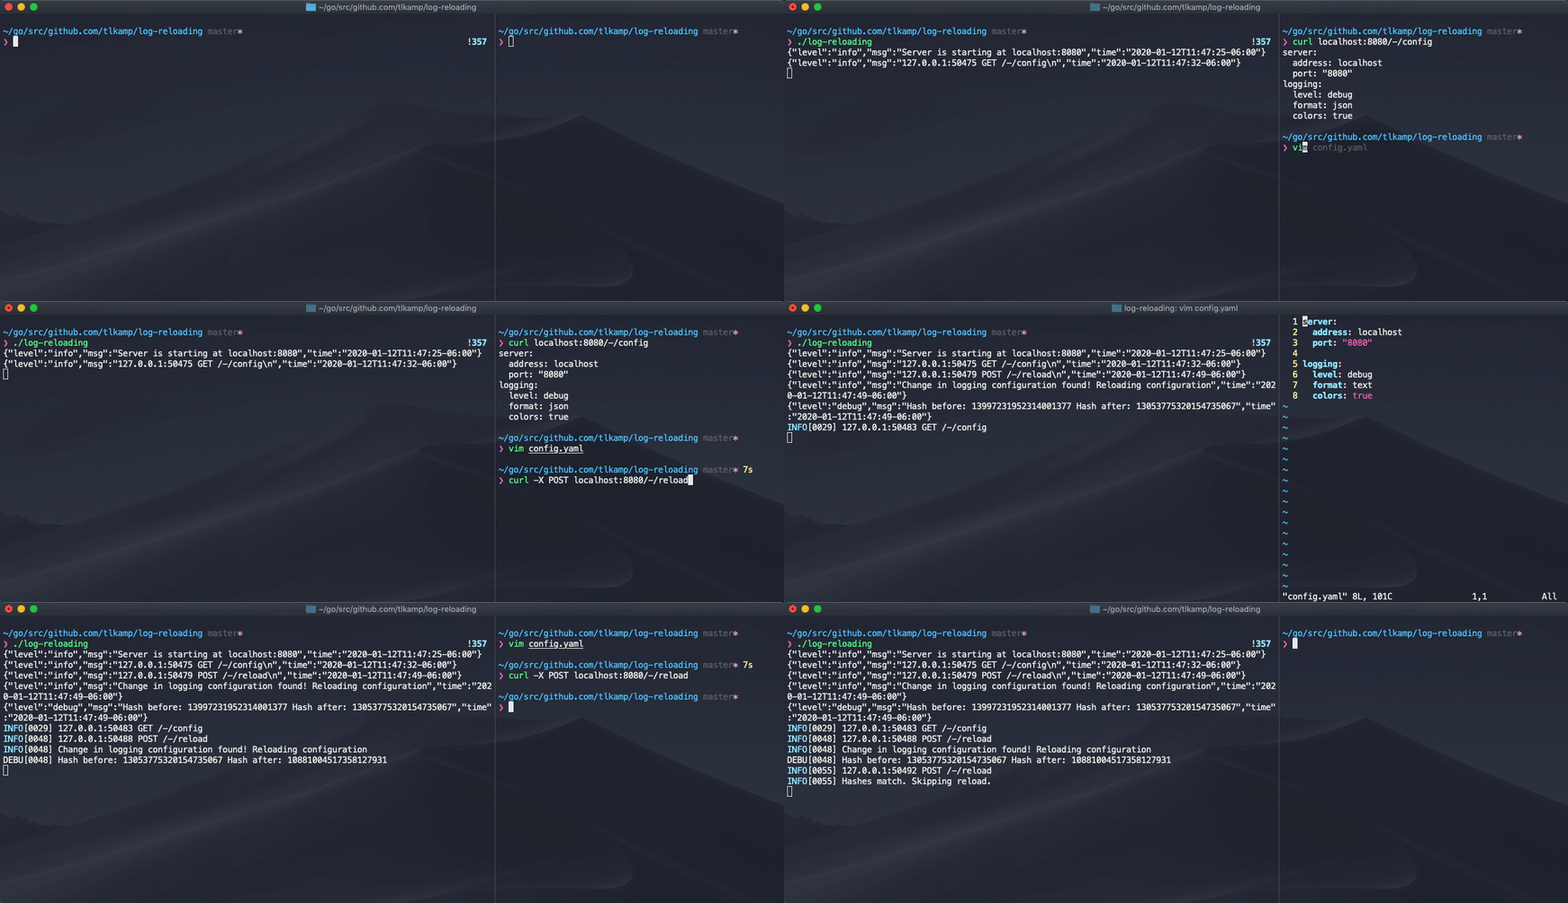
If we start our server using go run main.go, we will get a message that our server is starting on localhost:8080. We are ready to send requests!
View the currently loaded configuration:
$ curl localhost:8080/-/configChange the configuration file and trigger a reload (you’ll have to send more requests to see the changes take effect):
$ curl -X POST localhost:8080/-/reloadDo less work
Another key principle of Site Reliability is not performing extra work. Having our server reload a configuration file if it hasn’t changed falls into the “extra work” category. Let’s update our code to only update the logging configuration if the file has changed.
How do we know if the configuration changed?
To ensure we are only performing necessary work, let’s compute and store a hash of the currently loaded configuration internally.
We can add this hashing functionality to our existing loadLoggingConfiguration function. When the /-/reload endpoint receives a request, a hash of the “new” configuration will computed and compared with the current configuration. If the hashes match, the configuration hasn’t changed and no extra work is performed. If they do not match, the logging configuration is updated.
The final product


